Skillcept Online
Key takeaways
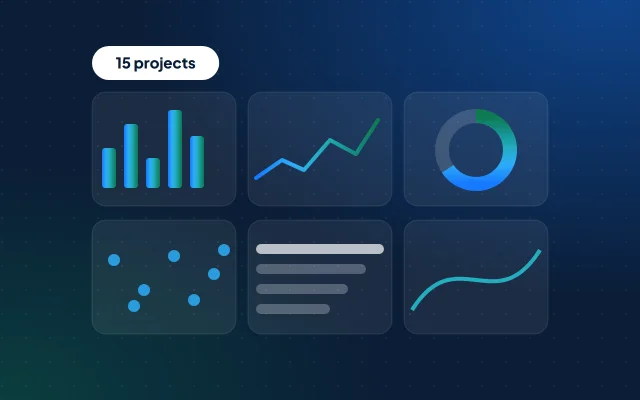
- 15 projects, five at each level, on official data you can get free: CPCB, IMD, RBI, MoSPI, the Election Commission, TRAI, NHB and the Ministry of Agriculture, plus Cricsheet’s open IPL data.
- Proof beats claims: 40% of employers in India prefer demonstrable AI skills or certifications over degrees (NASSCOM and Indeed, May 2026).3
- Data on data.gov.in is under GODL-India: you may use, adapt and publish it, commercially too, if you credit the provider, the source and the licence.1
- A strong project answers one business question, shows the messy cleaning honestly and ends with a decision someone could act on.
- 39% of data and analytics job postings in India mention AI (Indeed Hiring Lab, September 2025): give one advanced project an AI step, and check what it produces.5
The 15 projects at a glance
Five beginner projects need only Excel, Power BI and basic SQL; five intermediate ones add pandas, joins across sources and statistics; five advanced ones add forecasting, machine learning and text. Pick three that fit your target role, in three different tools.
| Project | Data from | Level | Skills |
|---|---|---|---|
| 1. Where is the air worst, and when? | CPCB | Beginner | Excel, Power BI |
| 2. Is the monsoon getting less reliable? | IMD, on data.gov.in | Beginner | Excel, statistics |
| 3. How fast is UPI growing? | RBI | Beginner | Excel, Power BI |
| 4. What pushed prices up? | MoSPI | Beginner | Power BI, index numbers |
| 5. Which districts grow the most rice per hectare? | Ministry of Agriculture | Beginner | SQL, Excel |
| 6. When should an onion farmer sell? | Agmarknet, data.gov.in | Intermediate | pandas, SQL |
| 7. Road deaths for the number of vehicles | MoRTH, on data.gov.in | Intermediate | SQL, Power BI |
| 8. Who is winning mobile subscribers? | TRAI | Intermediate | PDF extraction, SQL |
| 9. How did turnout differ in 2024? | Election Commission | Intermediate | pandas, statistics |
| 10. Have house prices beaten inflation? | NHB, MoSPI | Intermediate | pandas, Power BI |
| 11. How much does a weak monsoon cut rice yields? | IMD, Ministry of Agriculture | Advanced | pandas, regression |
| 12. Which sectors are banks lending to fastest? | RBI DBIE | Advanced | Forecasting |
| 13. What helps young graduates find work? | MoSPI (PLFS) | Advanced | Survey weights, ML |
| 14. An IPL win-probability model | Cricsheet | Advanced | pandas, ML |
| 15. Does the RBI’s tone hint at its next move? | RBI | Advanced | NLP, LLMs |
Every dataset link below was opened on 17 Oct 2026. Portals change: if a link moves, search the publisher’s site for the dataset’s name.
What makes a project worth showing?
A project worth showing answers one business question with real data, shows the cleaning honestly and ends in a decision someone could act on. Employers look for that kind of proof: 40% of employers in India prefer demonstrable AI skills or certifications over degrees,3 and 30% of Indian employers find skills-based hiring effective, against 19% globally (World Economic Forum, January 2025).4
- A question with a decision attached: “which mandi should a farmer sell in?”, not “analysis of onion prices”.
- Real, messy data, with the cleaning shown rather than hidden.
- One clear result, in a sentence and a chart.
- Limits stated: what the data can’t tell you.
- A spread of tools across your three projects: a dashboard, a SQL analysis and a Python analysis.
- Fresh data: Titanic and Iris tell an interviewer little about you; Indian data gives them something to ask about.
These projects fit stage 5 of our Data Analyst roadmap. A polished beginner project beats an unfinished advanced one, so start lower than you think.
Can you use this data?
Yes, with credit. Data on data.gov.in is published under the Government Open Data License – India (GODL-India), which lets anyone use, adapt and publish it, for commercial and non-commercial purposes, as long as you acknowledge the provider, the source and the licence.1 Other sources set their own terms: Cricsheet’s data is under the Open Data Commons Attribution License,2 and the RBI, MoSPI, Election Commission, TRAI and NHB sites each have terms of use worth reading before you republish their files.
- Credit every source in your README: the publisher, the dataset’s name, the link, the date you downloaded it and the licence.
- Say what you changed: what you filtered, cleaned and merged.
- Link to large raw files rather than copying them into your repository; publish your analysis and charts.
- Survey microdata (project 13) comes with the portal’s own terms: publish your aggregate results, not the unit-level files.
Beginner: projects 1–5
Excel, Power BI and first SQL. Each takes a weekend or two.
1. Where is India’s air worst, and when?Beginner
Data: the Central Pollution Control Board’s AQI Data Repository, its national store of real-time and historical air-quality data. Skills: Excel, Power BI.
- Download two years of daily AQI for 8–10 cities.
- Flag impossible values and gaps: CPCB notes that live readings come straight from instruments, without human checks.
- Build a PivotTable of average AQI by city and month, coloured as a heatmap, and count the days above 200 (Poor or worse on CPCB’s scale).
- Make a one-page Power BI report: a map, the heatmap and the worst weeks.
Stretch: add data.gov.in’s hourly Real time Air Quality Index from various locations to find which pollutant drives each city’s AQI. Show it: lead with one sentence that answers the question, then the chart that proves it. Module 7 of our program builds a daily air-quality report for Indian cities on CPCB data, too.
2. Is the monsoon getting less reliable?Beginner
Data: the India Meteorological Department’s Sub Divisional Monthly Rainfall from 1901 to 2017 on data.gov.in, in millimetres. Skills: Excel, descriptive statistics.
- Keep your sub-division and add up June to September for each year.
- Compare decades: mean, standard deviation and coefficient of variation (standard deviation ÷ mean).
- Count the years more than 20% below the 1901–2017 average, decade by decade.
- Chart the yearly totals with a 10-year moving average.
Stretch: test whether 1988–2017 differs from 1901–1930 with a t-test in Python. Show it: state the limit plainly: this file ends in 2017.
3. How fast is UPI growing, and is the average payment getting smaller?Beginner
Data: the Reserve Bank of India’s monthly Payment System Indicators (Excel and PDF), with volume and value for each payment system, UPI among them. Skills: Excel, Power BI.
- Copy UPI’s volume and value from 24 or more monthly files into one tidy sheet: month, volume, value.
- Average payment = value ÷ volume. Watch the units each file uses.
- Work out month-on-month and year-on-year growth.
- Compare UPI with cards and the other systems in the same files.
Stretch: a Power Query that appends each new month’s file by itself. Show it: one chart of average payment size, with the unit conversion explained.
4. What pushed prices up, and do villages and cities differ?Beginner
Data: the Ministry of Statistics’ Consumer Price Index on eSankhyiki: monthly indices and inflation, rural, urban and combined, by state and by division, group and item. The current series has base year 2024. Skills: Power BI or Excel, index numbers.
- Download the all-India rural and urban indices for each division, such as food and beverages, housing and health.
- Recompute a month’s inflation from the index a year earlier (where the series has both months), and check it matches MoSPI’s figure.
- Rank the divisions by inflation, and chart the rural–urban gap.
Stretch: find the states whose inflation ran above the all-India rate in most months. Show it: explain an index in one line: 109 means prices 9% above the base year.
5. Which districts grow the most rice per hectare?Beginner
Data: the Directorate of Economics and Statistics’ Area, Production & Yield reports (Ministry of Agriculture and Farmers Welfare), by state, district, crop and season, from 1997–98 to 2022–23, exportable to Excel. Skills: SQL, Excel.
- Export rice for two or three states, every season and year, and load it into MySQL or PostgreSQL.
- Compute yield (production ÷ area) and check it against the published yield.
- Rank districts by average yield over the last five years, and use
LAGto find the fastest risers. - Fix district names that change spelling between years with a mapping table.
Stretch: compare kharif and rabi rice, or repeat for a pulse. Show it: the .sql file, the results table and three sentences. Our SQL interview questions cover every query this needs.
Intermediate: projects 6–10
Two sources joined, messier files, and a statistical test or two.
6. When should an onion farmer sell, and where?Intermediate
Data: Agmarknet 2.0’s price and arrival reports (Directorate of Marketing & Inspection), by state, market, commodity and variety; and data.gov.in’s Current Daily Price of Various Commodities from Various Markets (Mandi), with minimum, maximum and modal prices. Skills: pandas, SQL window functions.
- Collect two or three years of onion prices and arrivals for one state’s main mandis.
- Clean: drop zero or blank modal prices, standardise market names, and keep the unit (₹ per quintal) in the column name.
- Seasonality: each month’s average modal price ÷ that year’s average.
- Do prices fall when arrivals peak? Plot both, then lag arrivals by a few weeks.
Stretch: forecast next month’s price and beat a seasonal-naive baseline. Show it: end with advice a farmer could act on, in one sentence.
7. Which states have the most road deaths for their number of vehicles?Intermediate
Data: the Ministry of Road Transport and Highways’ Road Accidents in India 2022 tables on data.gov.in, state by state: persons killed and road accidents; and its State/UT-wise Total Registered Motor Vehicles in India from 2012 to 2022 (in thousands, as on 31 March). Skills: SQL or Power Query, Power BI.
- Load all three and standardise state names: Dadra and Nagar Haveli and Daman and Diu are merged (from 2020 in the accident tables, from 2018 in the vehicle table).
- Join them, converting vehicles from thousands.
- Deaths per 10,000 registered vehicles, by state, and which states improved on the year before.
- Map it in Power BI, with the raw counts beside the rates.
Stretch: the same 2022 collection has accidents in million-plus cities by weather, junction type and traffic violation. Show it: explain why rates beat raw counts, and what a rate per vehicle misses.
8. Who is winning India’s mobile subscribers, circle by circle?Intermediate
Data: the Telecom Regulatory Authority of India’s monthly Telecom Subscription Data reports (PDF; the latest, for August 2026, came out on 28 September 2026). Skills: PDF extraction (Power Query or Python), SQL.
- Download 12 monthly reports and extract the subscriber tables by operator and service area (telecom circle).
- Build one tidy table: month, service area, operator, subscribers.
- Reconcile your totals with TRAI’s stated totals before you analyse anything.
- Net additions, market share by circle, and a concentration measure (the Herfindahl index).
Stretch: broadband subscribers, or wireline against wireless. Show it: the reconciliation table is your proof that the extraction worked.
9. How did turnout differ across constituencies in 2024?Intermediate
Data: the Election Commission of India’s General Election to Lok Sabha 2024 statistical reports (PDF and Excel): PC-wise voter turnout, participation of women electors, constituency types and constituency-wise results. Skills: pandas, statistics.
- Load the turnout and women-electors tables and join them on state and constituency. Surat had no poll, and the reports treat it separately.
- Turnout by state, and by general, SC and ST constituencies.
- Where is the gap between women’s and men’s turnout widest?
- Test whether turnout differs between reserved and general seats, and say what the test can’t show.
Stretch: turnout against winning margin, from the detailed results. Show it: keep it about turnout and participation, not parties.
10. Have house prices beaten inflation, city by city?Intermediate
Data: the National Housing Bank’s RESIDEX city-wise Housing Price Indices (quarterly, at assessment prices and at market prices for under-construction homes, with a composite index for 50 cities; base year 2024–25), and MoSPI’s CPI (project 4). Skills: pandas, index maths, Power BI.
- Download the city indices, and the CPI for the same period.
- Average the monthly CPI into quarters.
- Rebase both to 100 at the same quarter.
- Real change = (1 + house-price change) ÷ (1 + CPI change) − 1. Rank the cities.
Stretch: where do the assessment-price and market-price indices disagree, and why might they? Show it: small-multiple charts, one per city.
Advanced: projects 11–15
Forecasting, machine learning and text, with honest evaluation. These suit Data Scientist and AI-leaning analyst roles.
11. How much does a weak monsoon cut rice yields?Advanced
Data: IMD rainfall (project 2) and the district crop data (project 5). Skills: pandas, regression (statsmodels).
- Build, and publish, a table mapping each district to its IMD sub-division.
- Keep the years both files cover (1997–98 to 2017) and kharif rice only.
- Regress yield on June–September rainfall, with a year trend and sub-division effects.
- Report the effect per 100 mm with its confidence interval, and discuss what irrigation does to it.
Stretch: allow for too much rain as well as too little, with a squared term. Show it: a scatter with the fitted line, and a “what this does and doesn’t show” box.
12. Which sectors are banks lending to fastest?Advanced
Data: the RBI’s Database on Indian Economy (DBIE): Deployment of Bank Credit by Major Sectors (monthly, January 2019 to July 2026 when we checked) and Industry-wise Deployment of Bank Credit, on the same page. Skills: time series, forecasting.
- Export outstanding credit by sector, such as agriculture, industry, services and personal loans.
- Year-on-year growth, and each sector’s share of the total.
- Read the RBI’s footnotes for one-off breaks, such as mergers, before you trust a jump.
- Forecast three months with a seasonal-naive baseline and an exponential smoothing model; backtest on the last 12 months and report the error.
Stretch: which industries’ credit grows faster than industry as a whole? Show it: the backtest table, so the forecast earns trust.
13. What helps young graduates find work?Advanced
Data: MoSPI’s Periodic Labour Force Survey (PLFS), Calendar Year 2025 unit-level data on the national microdata portal (a free account is needed to download it). Skills: survey weights, logistic regression.
- Read the data dictionary, then keep people aged 15–29 with at least a graduate degree.
- Define employment the way PLFS does (usual status or current weekly status), and say which you used.
- Weighted unemployment rates by state, gender, and rural or urban; compare them with unweighted ones to show why weights matter.
- Fit a weighted logistic regression and report odds ratios as associations, not causes.
Stretch: compare with an earlier year, noting that the survey’s design changed in January 2025. Show it: a methods note a statistician would accept.
14. Can you estimate an IPL team’s chance of winning, ball by ball?Advanced
Data: Cricsheet’s IPL ball-by-ball data (1,243 matches when we checked; JSON and CSV), under the Open Data Commons Attribution License. Skills: pandas, machine learning.
- Flatten the match files into one row per ball.
- For second innings, build features: runs needed, balls left, wickets in hand, required rate.
- Train on older seasons and test on the latest, so the model never sees the future.
- Start with logistic regression, then try gradient boosting; judge both on log loss and a calibration plot.
Stretch: a Streamlit app that draws the win-probability line for any match. Show it: credit Cricsheet as its licence asks.
15. Does the RBI’s tone hint at its next rate move?Advanced
Data: the RBI’s Monetary Policy page: bi-monthly policy statements and Monetary Policy Committee resolutions, by date. Skills: NLP, LLM APIs, evaluation.
- Collect several years of MPC resolutions, with each meeting’s repo rate decision.
- Remove the sentences that state the decision, or the model will simply read the answer.
- Score tone three ways: a word list, sentence embeddings, and an LLM labelling sentences; check 50 of the LLM’s labels by hand.
- Test whether tone at one meeting predicts the next decision. With so few meetings, keep the model simple and use leave-one-out.
Stretch: a small retrieval (RAG) assistant that answers questions about the statements and cites the paragraph. Show it: a limitations section as long as the results.
On GitHub and in an interview
Give each project its own repository, with a README whose first line answers the question, and practise telling it as a two-minute story. Recruiters skim the README; interviewers dig into the decisions.
air-quality-india/
├── README.md
├── data/README.md
├── notebooks/
│   ├── 01_clean.ipynb
│   └── 02_analysis.ipynb
├── sql/queries.sql
├── dashboard/report.png
└── requirements.txt
The README tells the story; data/README.md says where each file comes from, with links; the dashboard screenshot means nobody needs Power BI to see your work. A README that works:
# Where is India's air worst, and when?
**Answer:** one sentence with the finding.

## Question
Who would use this, and for what decision?
## Data
Publisher, dataset name, link, date downloaded, licence.
## Method
Cleaning steps, then the analysis, in plain words.
## Findings
Three bullets, each with a number.
## Limits
What this data can't tell you.
## Run it
How to reproduce the results.In the interview, tell it in five parts:
| Part | What to say |
|---|---|
| Question | Who needed the answer, and what they’d decide with it |
| Data | Where it came from, and the worst problem you found in it |
| Method | What you did, and one choice you’d defend |
| Result | The finding in one sentence, with a number |
| Next | What you’d do with more time or more data |
Expect follow-ups such as “why that metric?”, “how did you handle missing values?”, “what would change your conclusion?” and, if you used an AI tool, “how did you check its output?”. Rehearse each answer out loud; on our program, mock interviews unlock once you complete, so you tell your capstones to someone who asks these follow-ups. The Python interview questions cover the pandas behind most of these projects.
Questions
How many projects should a data analyst resume have?
Three finished projects, each answering a business question in a different tool (a dashboard, a SQL analysis and a Python analysis), do more than ten half-finished ones. Put the strongest first.
Can I use data.gov.in data in my portfolio?
Yes. Data on data.gov.in is under the Government Open Data License – India, which allows use, adaptation and publishing, commercially too, as long as you credit the provider, the source and the licence.
Are Kaggle datasets fine for portfolio projects?
Yes, if the dataset’s licence allows it and the data isn’t overused. Check the licence on the dataset page, and prefer data that lets you ask a fresh business question over Titanic or Iris.
Should I use Indian data or global data?
Indian data gives an Indian interviewer a question they understand at once, such as UPI, the monsoon or mandi prices, and shows you can handle real, messy public files. Global data is fine if the question is sharp.
What if my project finds nothing interesting?
Say so, and show how you checked: “no clear effect, and here is why I believe that” is a result. Interviewers judge how you reached a conclusion more than the conclusion itself.
Sources
- OpenStreetMap Wiki, Open Geospatial Data from Government of India (a summary of GODL-India; the licence text is on data.gov.in), read 17 Oct 2026.
- Cricsheet, Licensing, read 17 Oct 2026.
- NASSCOM and Indeed, India’s AI Talent Inflection Point, May 2026.
- World Economic Forum, Future of Jobs Report 2025, 7 Jan 2025.
- Indeed Hiring Lab, September 2025 labour market update, 25 Oct 2025.